


We’ve been building something new at Shown Space and we’re excited to introduce the first version of the Game Center, a historical (and soon, live) game tracker designed to give you the clearest view yet of how a game unfolds. Possession by possession, stat by stat, the Game Center helps you follow the action, understand who’s winning the margins, and track momentum as it shifts.
What You’ll See in Game Center
Our goal is to make this the best way to follow ultimate in real time. For now, Game Center focuses on visualizing past games, including:
Win Probability Graphs: We’ve built a custom win probability model that accounts for field value (FV), time remaining, score differential, and possession. It provides a smooth, game-aware estimate of each team’s chances.
Expected Contribution Totals: Much like expected goals (xG) in soccer, total aEC captures a team’s expected score. In ultimate, this is based on field position and turnovers. It’s one of the most predictive stats we’ve seen – teams that generate more aEC win 88% of the time in our data.
Game Flow Visualization: This compact chart shows lead changes and score margins in a single timeline, making momentum shifts and game trends recognizable at a glance.
How Our Win Probability Model Works
Modeling win probability in ultimate is challenging. Time, field position, and possession all play major roles and interact in complex ways. To account for this, we built a hybrid model that adapts to the flow of the game inspired by Michael Beuoy’s NBA model at inpredictable.com.
Early and Midgame: Smoothed, Context-Aware Estimates
For most of the game, we rely on a logistic regression model with smoothed inputs, using the locfit package in R. This approach fits local polynomial regressions around each point, allowing the model to respond to context without imposing a rigid global structure. It adapts to how real games work—where time, score, and field position don’t follow simple or linear patterns.
The model uses three main features: score differential, time remaining, and field value (FV).
FV plays a critical role in this part of the model. As explained in our previous article, FV is a model based approach that reflects the scoring likelihood from any point on the field, incorporating possession context and historical outcomes. It’s especially valuable because it simplifies spatial complexity into a single, game-aware input that captures both risk and opportunity.
This win probability model helps the model learn important patterns, such as:
A 2-point lead early in the game give a moderate advantage
A 2-point lead with 30 seconds left is almost decisive
Field position has different implications depending on time and possession
The result is a smooth, non-parametric model that reflects how real games actually work.
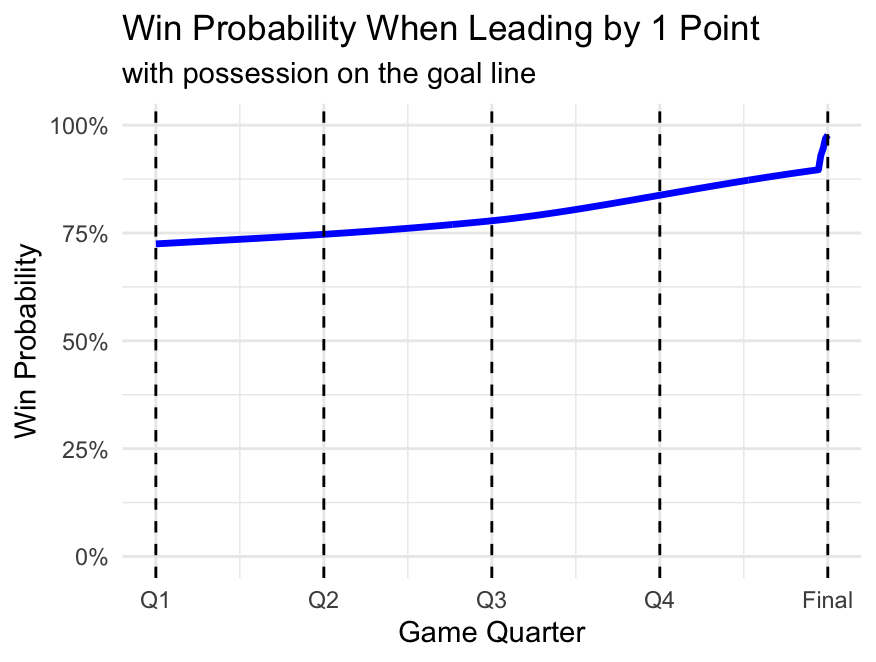
You can see this in action in the win probability charts we've included. For example:
When leading by 1 and having possession on the goal line, win probability rises steadily as expected.
When leading by 1 while defending the goal line, the model shows a late-game spike as an artifact of the transition to our endgame model. While the jump seems sharp and we hope to smooth it out in following iterations, this is still expected behavior. Teams in this position are likely to concede and see the game tied. Except in the case with the clock running out and a must score situation.

When losing by 1, field value drives predictable trends: a value of 1 (with possession at the goal line) brings win probability close to 50%, while a value of -1 (defending in your own redzone) drops the percentage to around 15%.

These visualizations show the model’s ability to reflect the dynamic, nonlinear nature of ultimate.
Final 30 Seconds: Sharp, Tree-Based Precision
In the final 30 seconds, the game changes. There may only be one or two possessions left, and small differences in field position or timing become decisive.
At that point, we hand off to an XGBoost model trained on score differential, time remaining, distance to the end zone, and possession. The exclusion of FV and inclusion of distance to endzone and possession captures the most decisive elements of late-game situations without overcomplicating the spatial context when buzzer beaters remain the strategy rather than traditional positional ultimate. Tree models are ideal for this phase because they:
Capture abrupt transitions, like “trailing with 10 seconds and no disc = ~0%”
Learn clear decision boundaries that smooth models can miss
Together, this hybrid approach gives us a model that:
Remains smooth and realistic throughout most of the game
Becomes sharp and decisive when time is expiring
Avoids illogical behavior with carefully tuned guardrails (e.g., understanding that a pull/possession switch follows a goal)
Further examining the previous win probability charts we see the sharp change near the end where the smooth nature of the logistic regression would fail to capture the confidence in outcome inherent with such little time remaining. We see this as
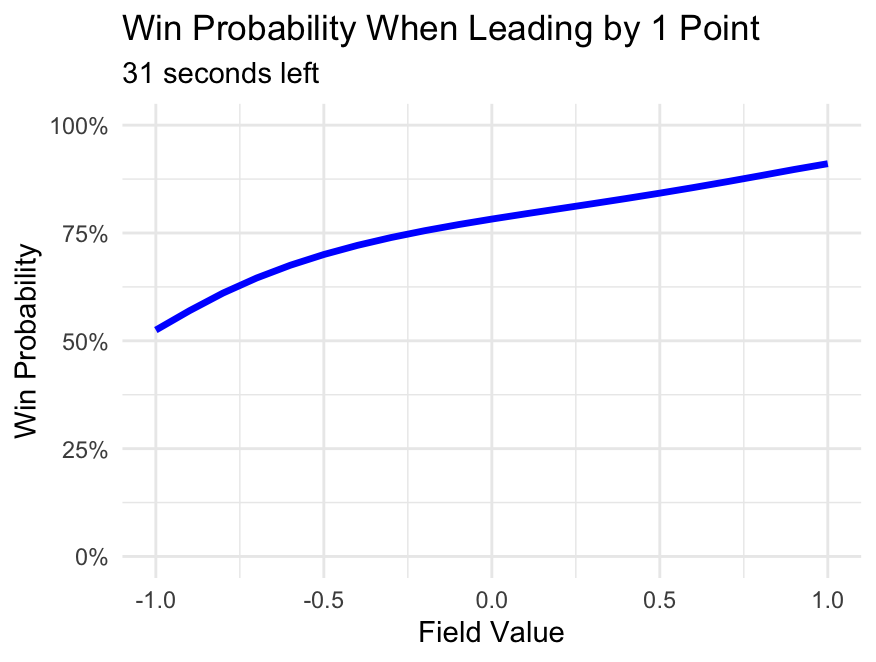
Win probability varies when leading by 1 with 31 seconds left, emphasizing how different field positions affect the outcome. Certainty barely reaches 90% even when you have possession at the goal line already leading by a goal while the XGBoost model is very certain knowing that you are up and have possession.
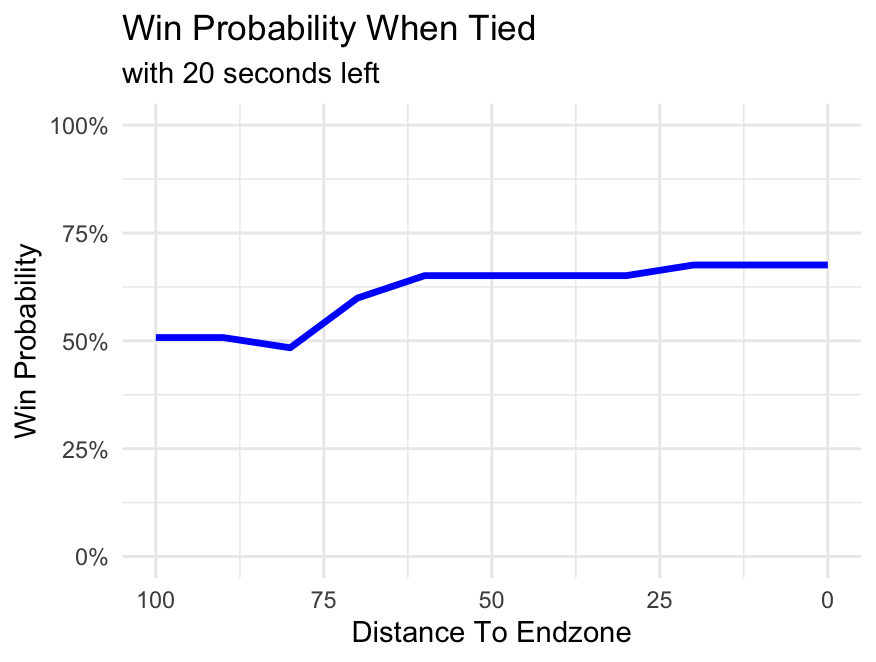
Finally, our XGBoost model estimates win probability when tied with possession, depending on distance to the end zone with 20 seconds left.
Together, this hybrid approach gives us a model that:
Is smooth and intuitive when it should be
Is sharp and realistic when it has to be
Coming Soon: What’s Next
We’re actively building and prioritizing the next wave of features. Here’s what you can expect next:
Live Game Centers: Soon, you’ll be able to follow games in real time. We’re adding visual, animated play-by-play sequences so you can see how each possession unfolds even if you can’t watch the stream. It’s the next best thing to being there.
Win Probability-Based Player Metrics: We’re extending our models to evaluate players in terms of their impact on win probability. That includes Win Probability Added (WPA), a game-based MVP calculation, and even LVPs (Least Valuable Players) whose mistakes cost the team the most. These stats will provide a new lens for evaluating clutch performance and high-leverage errors.
Team Pages and Rankings: A bit farther down the road, we’re developing team hubs with season-level breakdowns, performance tracking, and mathematically driven power rankings. These won’t just be based on wins and losses, they’ll reflect field value created, consistency, and matchup-adjusted performance.
We’re building for analysts, coaches, and fans who want to see the game more clearly. If that sounds like you, stay tuned.